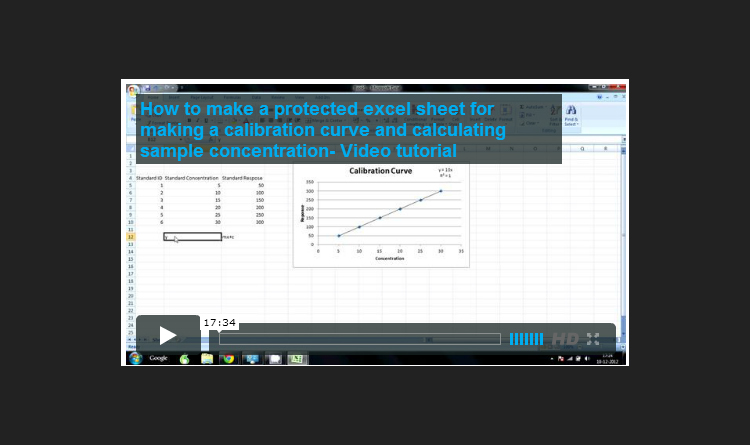
How to make a calibration curve and calculate sample concentrations using Excel – Video Tutorial

Excel Calibration Curve Video TutorialWorking in the laboratory, there are a number of different ways that we can calculate the amount of an analyte present in a sample by comparing them to standards. You could use a single external standard, a calibration curve, internal standard or use standard addition. Learning to use these different methods of calculation is essential to working in the laboratory and is a essential part of any laboratory training program.
This is a video tutorial for making an Excel sheet to create a calibration curve using six standards and using it to automatically back calculating unknown sample concentrations.
The sheet also includes a dilutions factor calculator using which the concentration of analyte in the undiluted samples can also be automatically calculated.
We also show you how to protect the Excel sheet so that the formulas cannot be altered by mistake and also you can further validate the Excel sheet for use in a regulated environment.
For best results see the video in HD, in full screen mode and use headphones for better sound clarity.
From the video tutorial you will learn how to –
- Enter data for a calibration curve in excel
- Make a calibration curve with linear regression trend line
- Display the linear regression equation of the line on the graph
- Display r2 value of the regression line on the graph
- Calculate the slope and intercept for the regression line using formulas
- Calculate the concentration of unknown samples using the equation y = mx + c
- Calculate dilution factor for samples which are diluted prior to analysis
- Calculate undiluted sample concentrations
- Protecting the excel sheet so you can validate it in the future
- Formatting the excel sheet so it can be printed properly on one sheet of paper
What can you use this sheet for?
You can use this sheet for calculating sample concentration from a standard calibration curve for any technique like HPLC, GC, UV, AAS or any other technique where linear regression is used. You can also use it in method validation to evaluate linearity of the response and establish the range of the method.
Please leave your comments below!
Please share your feedback on this video and let us know what other topics you would like us to cover in the future by leaving your comments below and don’t forget to share it with your friends!


Thank you very much for this nice video.
Actually I am interested in knowing how can I calculate and represent in the chart the error of the result. When I calculate for instance a concentration by means of a calibration curve, I got a value. But I need to know how good is this value and a +/- around this value.
Thank you,
Fidor
I would like to thank you for this excellent video. I WOUNDER HOW I CAN COPY THE VIDEO SO I WOULD BE ABLE TO WATCH IT AGAIN IN CASE I LOST CONNECTION.
Hi, I am glad you liked the video, we do not have an option for downloading the video currently. we will check and see if it can be done.
Hello Mr. Arora
thanks a lot for uploading such a useful video….I also want to upload this video as it is very useful to the students who face the problem to prepare calibration curve in HPLC system software.
Thanks and God bless you.
DR. SHIWALI SHARMA
Hi Dr. Sahrma, let me know which site you want to upload it on and we will send you the link and permission. Glad you liked it!
Thank you for nice video. I have small question. Do I need to prepare calibration curve each time, conduct analysis. Or I can prepare once and use it for a couple of times. For example I run analysis of nitrate and get r2 0.998 to day, am I required to prepare calibration curve tomorrow for the same parameter
My advise is to prepare a calibration curve every time you conduct the analysis as the operational parameters and instrument performance can vary day to day. If this is not possible every time then at least run standard injections in between sample injections.
Just wanted to express my gratitude at you uploading this clear and helpful video that has aided me in determining Sodium Nitrite concentrations, couldn’t have done it with out you.
Best regards
hi Tobias! Thank you for your kind words!
Any clue to calculate and represent the error of a calibration curve?
Thanks,
Fidor
Hi Fidor, the regression line that we make using the calibration data accommodates for the errors. We usually look at the r square value and test for non zero slope to evaluate the suitability of the calibration curve. The errors for the individual points can also be shown if we have replicates (minimum 3) for each of the calibration points, then we could add error bars to the values. Also there is a method to produce a 90 or 95% confidence regression line for the curve. These are all statistical methods, how ever in analytical applications the calibration range is thoroughly evaluated for accuracy and precision during method validation. I hope my longish answer makes some sense!
Thank you for your presentation. It will be useful to who are working in AR@D and QC dept. it is good.
Hi, Thank you for this useful video!I have question: how do you calculate the concentration of your samples when the calibrator concentrations fit a sigmoidal curve?Is the process similar to what you showed in this video?
Hi, the process will be the same, you just need to change to nonlinear regression to fit the sigmoidal curve.
Hi, Thank you very much, I am glad to see the video, so much helpful for me , Could I downnloading the video currently ? , Thanks
Hi,Go ahead .No issue at all.
Thanks
Could you pleeze send me this video to my email [email protected] ?
thanks you, very much
Hi,
I understand you have difficulty downloading the video.Please let me know which video you are referring to so that we may offer help
very informative video. i would be grateful if you demonstrate how to calculate drug content in tablet using calibration curve .thank you
This video has been very useful to me, thanks very much for your work.
Hi. Thank you for sharing your knowledge with us, it is very informative. Could you do me a favour by sending this video (How to make a calibration curve and calculate sample concentrations using Excel – Video Tutorial) to my email? I want to download it but not able to. Thank you very much in advance.
Hi Syazana, It is a big video, about 800 MB will be difficult to mail it. I am glad you liked it, please feel free to refer to the site any time!
thank you for sharing. it is very useful to me
Syazana it is nice to hear that the video proved useful to you.
very informative..
Well done. :)
Thanks Robert for your compliment.
Hello Dr. Saurabh Arora sir,
thank you so much for sharing very informative video with us regarding how to prepare a calulator on excel sheet.
regards
abhishek aggarwal
M.Pharma ,PGDPRA
thank you very much Dr. Saurabh Arora for sharing. it is very informative and helpful to me. Can you show us how you calculate inflection point from S- shape curve using excel? and thank you again.
Radouane
The video proved to be really useful for calculations!
Thank you.
Thank you Allie!
thank you very much
very usefull video
Thank you very much Dr. Saurabh Arora for this, I am studying drug release and need to make dilutions of the aliquots I take out from dissolution at each time point. Like say for example I took 5 mL and then dilute it 1 in 100 to be able to read absorbance, how will I calculate the undiluted concentraion in that case.
Looking forward for your reply.
Thank you
Saad
Hi you can do the calculation using the formula C1V1 = C2V2
This is such a good demonstration of how to produce a calibration curve in excel. Thank you for taking the time to do this. It is really helpful to me and I am sure to many others.
Thank you so much. I found this very useful.
I do have a question though. When I referenced the cell with a link to (x-intercept value/slope value) in order to calculate other concentrations the answer was different than when I manually typed it in. The difference was slight (e.g 39.4 vs 39.2). In each case the referenced values were the same, the only difference being one had the intercept/slope values manually typed in and the other had a link to the cells which in themselves had a formual to create the intercept and slope values. Why would this be?
Hi Anita it could be due to rounding of the entered values, when you link the cells it takes the absolute values.
wooooow, you have made my working so simple for me. thank you very much. West Africa (Ghana) appreciates.
Glad to be of help!
merci beaucoup pour la video et pour les explications ,c’est très instructif et explicite
je voudrais si vous le permettez de compléter par toutes les utilisations de l’excell pour la realisation des validation
thank you very much i hope that you undersand french
heureux d’être de l’aide!
Can you tell me why you changed the concentration value of 15 to 12 before inserting the intercept formula?
Hi, That was just to show how the formulas are working in the sheet.
Very nice and useful video. It would be nice if you could stress the laboratory analysts on the importance of checking the standards at periodical intervals such that the response from the instrument is within the permissible limits of error and integrity of the standards is ensured. You may get a good r value, but the instrument response for the standards may be low. How about advocating having check samples with known value.
Thank you for your appreciation and I also share the value and stress you place on the intermediate checks of standards. If you can write a short article on this topic with your experiences we will be happy to publish it with you as the author.
I want to thank you so much for this video, its so helpful. God bless you.
Thank you very much, it is wonderful following you.
Hi Auwalu,
Nice to hear that. Hope now you will be able to complete your HPLC programme and earn the certificate also.
Very informative.. COuld you please tell me the unit of the concentration calculated ? I mean whether it is ug/mL r mg/mL ??
Hi, In this you can use any unit. The results will be in the same unit as used for the calibration curve standards.
Thank You Dr. Saurabh..
i want to know about when we prepare calibration curve some time regression equation show y = 0.0318x + 0.0065 and some time show 0.0984x-0.3422 so please tell me what is the difference between these equations
Hi sarvesh what is the r square you are getting? it looks like the correlation is not very good.
Thanks alot. This video has helped me so much.
Thank you for the video. It is clear and easy to follow. I just have one question in terms of using the dilution factor. If one has a stock solution of 6 analytes of 2500mg/L, then makes 6 standards by taking from the stock 4ml,20ml,,40ml,200ml,300ml and 400ml and making each to the mark of 1000ml; does a dilution factor play a role in final concentrations and how does one calculate for that?It doesn’t seem to make sense to me to follow the same calculation as in the template (that’s more for serial dilutions?), then again maybe I am wrong. Please explain or refer me to relevant text. Here one would be taking each of those volume from the 2500mg/L stock and making each of those volumes up to another litre.
Hi you can use the same formula and should get the correct results!
Thank you Arora sir giving me information,how to create linearity graph in excel sheet and u r excellence sir
you are welcome!
To be honest , it is very useful website and thank you for sharing your knowledge and experience.
thanks again and we are waiting for more.
best wishes.
Hi
Very usuful video but i have small quetion
Please explain defference between RSD caleculation and sample concentration….?
Sample concentration is the amount of analyte present in your sample. On the other hand RSD relates to the linearity of the calibration plot which you obtain a plot using 5-6 different known standard concentrations. A value of 1.00 RSD implies perfect linearity of plot and any value lower than 1.00 means slight deviation from linearity.
Hi
I appreciate you, thanks for the video. it make easy understanding
thanks a lot
hi,
Thank you sir for sharing such valuable information…
helo sir, useful video for students, could you please upload the finding unknownn concentrations in dissolution studies of combination drugs.
for combination drugs 2standard curves are prepared, so which standard curve i consider for finding unknown concentraion of mixture of drugs.
Hi, you will use the respective curve for each drug. Think of it like calculating for 2 single drugs.
The video was very insightful.
Thank so much for sharing
I have loads of sample that I analyzed using the spec but I have not been able to convert it fro absorbable to conc.
This video really helped me
But still not clear on the dilution factor calc
very informative video.
Thank you very much for this video, indeed it clarified all my doubts. Marking it in bookmarks :)
There is no video. How can I watch it, please?
Regards
Thanks for pointing out we will be dating it soon.
I would like to say thank you for this helpfull vedio and I hope that the calculation equation in case of dilution of the sample in the first step and after that concentration of part of the diluted extract as the final step in sample preparation.
Thank you for this excellent vedio