How to calculate System Suitability in Chromatography

High-Performance Liquid Chromatography (HPLC) technique is applied in various places to separate out a mixture’s components. Through this process, the liquid’s effectiveness is examined by passing it over an absorbent material.
One of the major applications of this technique is in the pharmaceutical industry, where experts research and test different components. System suitability testing is a part of this procedure.
In my earlier post on generation of authentic chromatographic data I had emphasized the need for evaluation of system suitability before proceeding with analysis. Some factors contributing to system suitability failures in HPLC were discussed. The current post introduces you to system suitability parameters and their acceptance limits.
But let’s first understand the concept of system suitability testing.
System Suitability Test (SST)
This testing is used for examining a liquid chromatographic system’s specs. That is why it is crucial to opt only for an appropriate method for the calculations. On the other hand, an acceptance criterion is also set, called the SST limits. It is vital to meet these limits before analyzing any sample for your purpose.
Now, let’s move on to the parameters that have to be checked under this testing.
Resolution
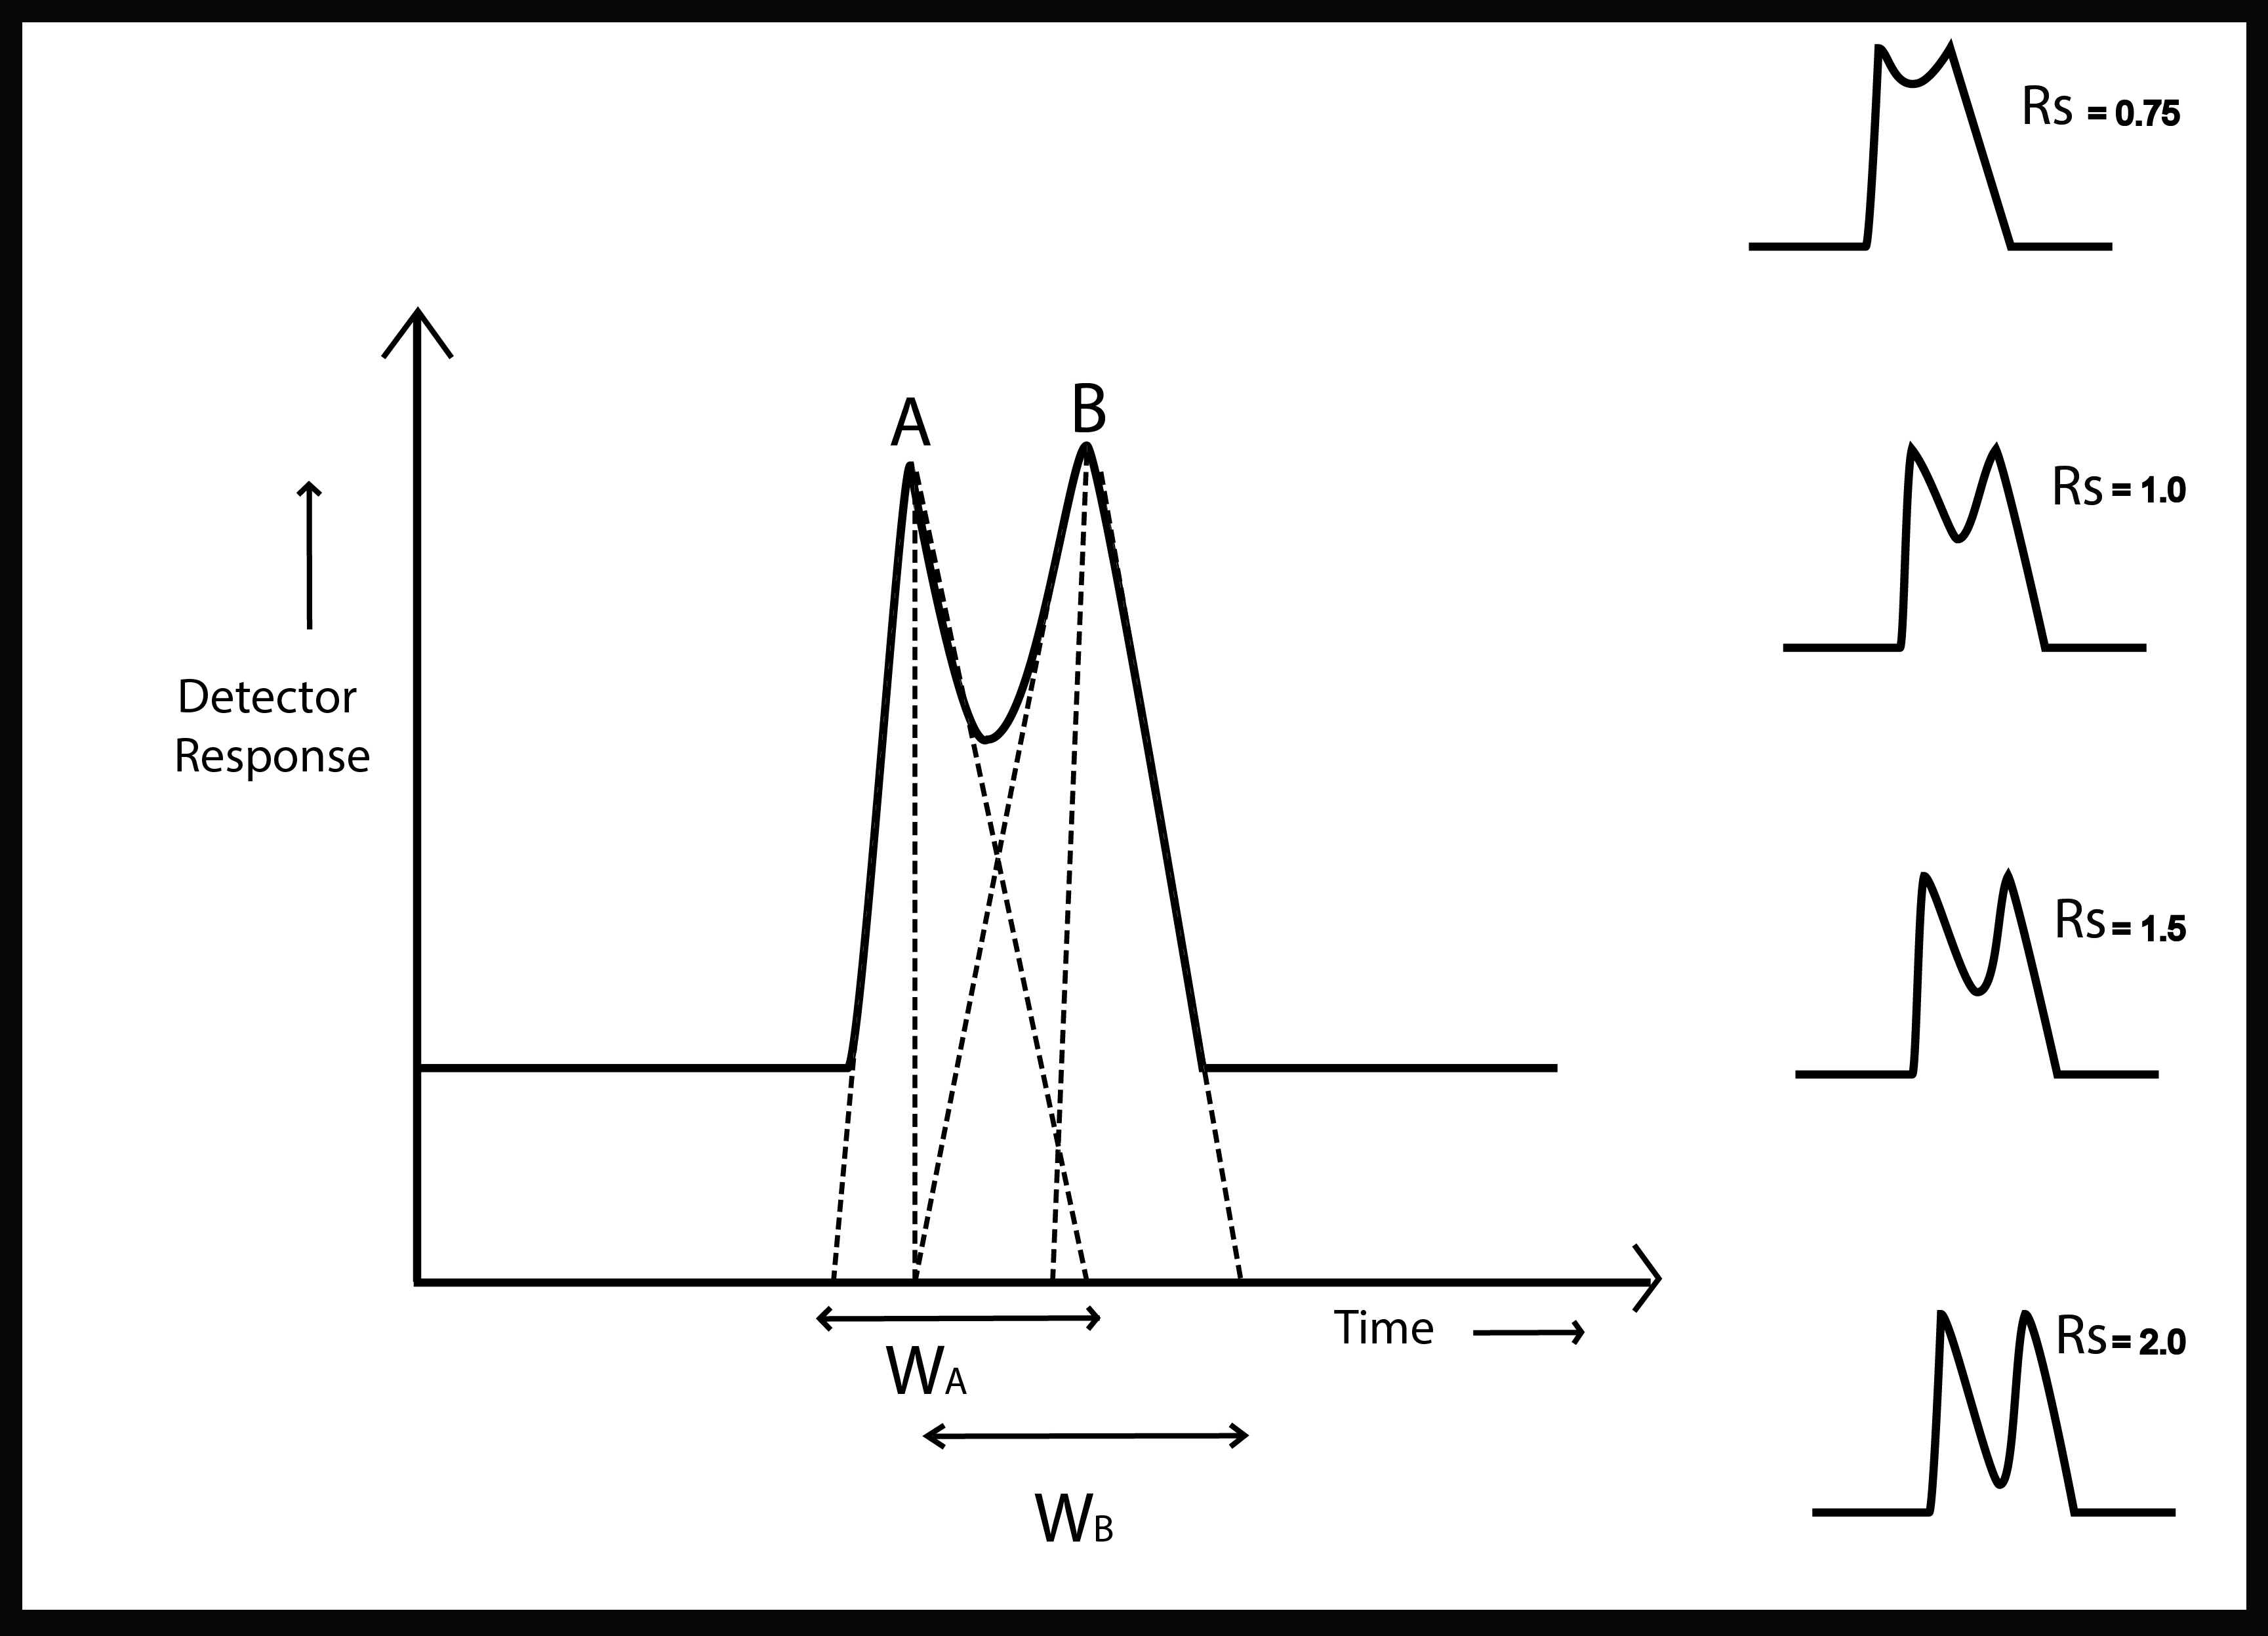
The resolution in HPLC is a measure of the quality of separation between two chromatographic peaks. It plays a crucial role in checking the feasibility of this critical separation according to the given circumstances.
Well resolved peaks are basic requirement in both qualitative and quantitative estimations. Separation between closely spaced peaks is governed by affinity for the stationary phase.
Co-eluting compounds can be resolved by:
- Change of mobile phase polarity
- Increase of column length
- Reducing particle size of stationary phase
\(
R_S=\frac {tR_B – tR_A}{0.5 (W_A + W_B) }
\)
Where\( tR_B \) and \(tR_A\) are retention times of peaks A and B
Peak widths \(W_A\) and \(W_B\) are obtained from the intersection of tangents with baseline
Almost all peaks show a bit degree of tailing. That is why the resolution is considered complete only if it equals or exceeds 1.5. Another important factor to consider here is that the equation can not be used if the peaks are not resolved at the level of baseline. But this is not something to worry about because it is virtually impossible for the peaks to overlap at the bottom. Even the peak baseline width measurement is not feasible.
In all other cases, this resolution formula in chromatography provides a much efficient outcome.
Resolution is considered complete if it equals or exceeds 1.5
Asymmetry or Tailing factor (\(A_s\))
An ideal chromatographic peak should be of symmetrical Gaussian shape but due to various factors the shape often deviates. Peak tailing is the commonly observed peak deformation. It is mainly due to occurence of more than one mechanism of analyte retention. Tailing can be reduced by changing mobile phase pH or end-capping of stationary phase.
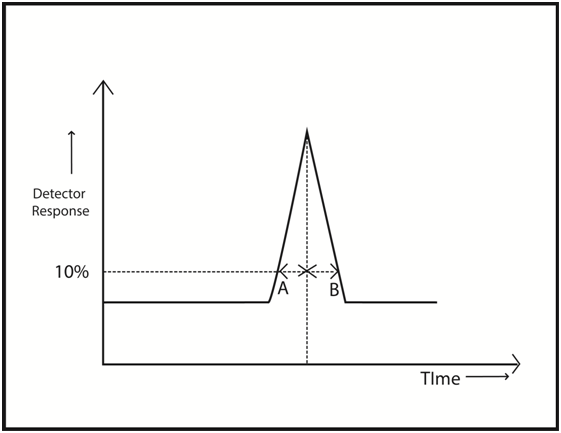
where A and B are peak widths at 10% of the height for leading and tailing ends of the peak
Ideal peak has As =1 but values in the range 0.9 – 1.1 are acceptable
Tailing becomes apparent when asymmetry factor As equals to or exceeds 1.2
As per USP definition the tailing is considered as the ratio of the widths a and b at 5% of peak height and the tailing factor formula is expressed as
T = [Latex] \frac {a+b}{2a}[/latex]
T should be less than or equal to 2 to satisfy the system suitability requirement.
The tailing factor in HPLC is also known as the symmetry factor.
Precision
Replicate injections of a standard preparation are used to ascertain if requirements of precision are met. This is used to demonstrate the system performance when it gets exposed to some specified column usage, environment, and plumbing conditions.
Data from five replicate injections are used if requirement of relative standard deviation is less than 2%. Data from six replicate injections are used if the requirement of relative standard deviation is more than 2%.
Signal To Noise Ratio (S/N)
This parameter is used for the lower-end calculation of the performance of the system.
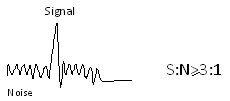
Noise: It is measured between two specific lines that bracket the baseline.
Signal: It is measured starting from the baseline’s middle and ending to the peak’s top.
Once calculating both these factors, the ratio can be measured by dividing the signal value by the noise value. With this, generally, the noise value has to be reduced using one of the following methods:
- Signal Averaging
- Reagent and Solvent Purity
- Column Flushing and Sample Clean-Up
- Temperature Control
- Additional Pulse Damping and Mixing
Theoretical Plates: Column Efficiency
The plate theory concept assumes that the chromatographic column comprises a large number of imaginary separation layers called theoretical plates. Equilibrium of the sample takes place between the stationary and the mobile phase in these imaginary plates. The analyte moves down the column by transfer of equilibriated mobile phase from one plate to the next.
Column efficiency is expressed in terms of theoretical plates(N).High resolution means greater number of plates in a given length of column. That is why it is always preferred to keep the plate number high for any provided column. The number of plates can be calculated by:
\(
N =16{[\frac{(t_R)}{W}}]^2\) Where W is the peak at base
or
\(N = 5.54{[\frac{(t_R)}{W\frac{1}{2}}}]^2\)
Where \( W_1_/_2\) is peak width at half height where
\( t_R\) is retention time and \( W_1_/_2\) is the peak width at half height
It is recommended that Theoretical plates should not fall below 2000
The benefit of opting for this method is that the number of theoretical plates can be calculated even if the resolution is poor, and the two consecutive peaks are not entirely differentiable. It becomes possible due to the use of half-height in the formula. However, the valley that lies between these peaks must be lower than their half-heights. Only then can the number be calculated.
The method is not much utilized in the manual calculations. Instead, it is mostly preferred for automatic verifications done on data systems. In the case of calculating the theoretical plate number, the following formula can be used:
Plate per meter = Number of theoretical plates in one column x 100 /HPLC column length in cm
A USP method for theoretical plate calculation can be used for other cases.
Retention factor (k’)
Retention factor (k’) or partition ratio or capacity factor is the relation of time spent by a compound in stationary phase to the time it spends in the mobile phase. This is one of those parameters that can be identified without any hassle.
k’ is a unitless quantity
\(k’ = \frac{t_r – t_m}{t_m}\)
Higher the value of k’ greater is the retention of a compound on a column
Ideally k’ should be greater than 2.0
You can easily calculate all the factors using these equations. However, you must remember that the final results can show extreme deflections based on the type of analysis you are performing and the analytical conditions around it. Plus, these tests are not only done at the beginning. You need to conduct them periodically to ensure that the system performance remains intact. The values may change with time because of the continuous use of the system.



what do you mean by the factor in resolution formula 0.5 and in theatrical plates formula 16 or 5.54. how it was introduced in formula and what is use of that. i mean from where it came. please sir i am new for this profession.
how to calculate lower detection limit for hplc
Hi Daud, LOD is calculated by signal to noise ratios or from the slope and intercept of linearity studies. S/N is usually the preference.
What are the factors responsible for the Relative Standard Deviation to exceed the limit?
Dear Sunil A host of factors can increase the RSD like injection volume, flow rates, sample prepration, temperature variation, evaporation of the stock solutions, gas quality variation You need to ID the one responsible by isolation and then solve it.
what is difference between resolution and usp resolution in empower
Suresh your question is not clear. Can you elaborate it.
In Empower software,there is two resolutions-one is Resolution and another one is USP Resolution.what is the difference between them.
the formula is different, you can check in the help file for exact details.
Why 5 or 6 replicate injection used in sst
You need to make replicate injections to achieve a high degree of reproducibility. After making a single injection you will not be sure about the accuracy of volume injected.
AS PER GLP AND USP GUIDELINES
Why we don’t used 10 injection in sst instead of 5 or 6?
Hi Meena,
If you can achieve the required precision in 5-6 injections why waste your time in making 10 injections. There is no guarantee that you will get improvements in 10, 15 or even 20 injections over your results so 6 is the optimum number .
There is a concept of 6 sigma and 3 sigma where in we need minimum 3-points for the agreement
i mean to see that your system is precised enough for the analysis u need to meet the criteria of RSD either with 3-points or with 5-6 points
Hi, having 6 points increase the statistical power and is generally prefered.
What is RsD calculation in system suitability
Hi Meena, it is Relative standard deviation the formula is standard deviation divided by mean times 100.
How to get sharp peak in phenomenox column?what s washing column procedure
Hi meena, the washing procedure is different for different column phases. What are you using?
Hi sir this srikanth
In system suitability parameters calculation
Formulas in resolution0.5,railing factory 2,
Teritacal plates 16…numbers is used could be explain sir……
Hi Srikanth
Your question is not understood . Please clarify what you wish to know
Why Assay specification is broad I.e 95% to 105%. But purity specification is NLT 99. 0%. What is the main reason
Hi Mahesh, the assay is for formulations where there are other ingredients and also the fact that on storage the assay might come down depending on stability. Thus the broader range.
Hello Dr. Deepak,
Is there any videos available to learn integration of peaks.
Hello Neena,
Yes videos on software control of instrument in our paid certificate course covers this aspect.
hello sir,
what is the system suitability requirement for bracketing standard and how many injections we should give .Because some companys are running sst 6 injections,check standard 2 injections and Two point claiberation 2 injections.And after 6 Injections of assay samples again they are giving two injections of two point caliberation.is it really needed.
This is usually based on the internal STP which is established during the method validation.
hi sir, in my Assay analysis for Acarbose tablets,pre injection of resolution got exactly 1.5(limit NLT 1.5)but in main sequence got 1.42, why, can you explain the reason
This could be due to sample degradation, are you using a refrigerated auto sampler?
Sir tell me about ideal peak
Ideal peak is free of any distortions or splitting and is shaped like a bell shaped Gaussian peak
How we will set oven temperatur in gc
Oven temperature is set by means of system software
How we will caleculate s/n in gc,
Plese explain which is exat rt to caleculate SN
S/n ratio is defined as the lowest concentration at which the signal is 3 times the average noise level.There is no particular Rt defined for measuring it. You can use a reference compound whose Rt can be established through repeated runs
What is the difference between Drug Purity and Drug Potency?
Please explain
Hi Sudhir these terms can be used interchangeably.
Hello sir,
Why we use Acetonitrile, and Methanol in preparation of HPLC mobile phase, why we not used remaining solvents and what is the reason
Solvent composition decides the overall polarity of the mobile phase. As the sample may contain more than one compounds of different polarities a mixture is generally used. The selected solvents should be fully miscible. Acetonitrile and Methanol are fully miscible with water as in caes of most aqueous phases.
Hello sir,
What are the units of vaccume, why some products are analysed in a vaccum oven.
Units of vacuum are torr. However, I have not come across any application which requires a vacuum to be maintained in the column oven. In any case since the fittings are airtight column oven pressure should not play any role in GC separations.
Hi sir good morning
Why we are not identify unknown peacks with there boiling point
Peaks are usually identified by retention times under the set of operating conditions using standard mixtures.The boiling points of compounds depend on purity. As purity can vary with sample matrix basing your judgement on boiling points can be misleading.
How we will set split ratio
with the help of system software.
What thing are keep in mind when we are integrate the chromotogram
In manual operation you have to get the best fit with baseline. However, the softwares have auto fit capability so this is taken care on its own.
In lab training.com online courses are only Hplc,Aas,safety…..?
I want to join Gc direct classes
Free course on GC is available.The paid on line certificate course is in pipeline and should be released shortly.
Which operating conditions are show sequencel order rt based on there boiling point
It was difficult to make sense from the question but if I have understood it correctly you mean what operating conditions are needed to get retention time in a sequence matching the boiling points of components.From basic physics you will agree that the components will vaporize at different temperatures depending on their boiling points. As the column oven temperature increases the components begin to evaporate in a sequence of increasing boiling points.
Good morning sìr
What is defference between known and uknown impurity
The answer is simple. Known impurities are those whose identity is known before the analysis and unknown are those whose identity is unknown.
Please tell me sir types of sample and types of Gc columns
Samples constitute any matrix which contain compounds of your interest whose identity and amount needs to be determined. These can be synthetic mixtures, or specimens of pharmaceuticals, foods, environmental samples, forensic residues,etc.GC columns are of different types depending on their dimensions and packing material. You are advised to register for the free course on GC which will give you clarity on fundamental concepts.
Why Analytical. method validation required
Analytical validation of a new method is important as it verifies that the method adopted will provide you reliable analysis. For more information you may browse through our articles on the topic which were published on 7th Feb 2017.
Hi there, You have done an excellent job. I will definitely digg it and personally suggest to my
friends. I’m sure they’ll be benefited from this site.
Thank you very much sir. I have indeed gain alot from your knowledge. may God increase u in knowledge,meanwhile i want to learn more on hplc
gister for our free course on HPLC through the site. Click on About us on top menu and then click on Free courses in the drop down menu.You can select the HPLC free course and register for it by providing your name and mail ID in the dialog box.On submission you will get a link in your mailbox . Click on th link and your registration is complete. You will start receiving the successive modules after a gap of 3-4 days each.
Kumarswamy
Hi sir what is the integration process of auto integration
Could you let me know the software that you are using to help us advise further.
Hello sir..! What is the Gaussian peak?
A Gaussian peak is a perfect bell shaped peak without any distortions. It rises above a perfect horizontal baseline and drops back to the same baseline after reaching the maximum height.
Helo sir!!
What is defference between accuracy and precision,is there any formul??
Accuracy relates to closeness of observed value to the true value whereas precision relates to closeness of observed values to a value which may or may not be a true value.
Hi sir gd mrng
What can base use to
Solvents are eluted in GC
Kindly rephrase your query as it is not understood.
Good morning sir..!!
What is the effect on our assay or RS if talling factor will be out of limit… Why be use limit of talling..
Ex:- our talling factor limit 1.5… And after calculations it will be found 1.8, Does it effect on our assay or rs?
Tailing factor will affect the area under the peak.In case you are getting tailing beyond the limit value obviously your quantitative result.
Hello sir good afternoon
My question is the GC column is decreasing the RT OF sample & standard on day by day so what are the main reason behind. kindly reply
Dear Samadhan,
The gradual decrease in retention time (RT) of both sample and standard on the GC column could be attributed to factors such as column degradation, contamination, changes in column temperature, or issues with the injection system
Good morning Sir
What is the difference between checking standard and bracketing standard?
And what is acceptance criteria for both?
Please let me know which software you are referring to.
Dear sir in theorical plate formula is 16*(tr/w)2 so the 16 come from where?
Like any mathematical formula it is difficult to state as to where from the factors come into any equation.
Sir explain the difference between Assay and RS in HPLC ?
Assay gives you the amount of active ingredient present in a pharmaceutical formulation whereas RS or related substances give you amounts of impurities present. In HPlC chromatogram the main peak is the active ingredient ant the other small peaks represent the related substances.
Hi everybody, here every one is sharing such know-how, so it’s pleasant to
read this blog, and I used to go to see this blog everyday.
Please let me know if you’re looking ffor a article writer for
your blog. You have some really great articles and I feel
I would be a good asset. If you evber want tto take some of the load off, I’d really like to
write some content forr your blog in exchange for a link back to mine.
Please blast me an e-mail if interested. Kudos!
Hi Larry,
I Got Your Mail for Regarding Paid Post on our Blog (https://lab-training.com) …
Our Guidelines for the Guest post …
Content should be unique and words count should be 500+…
Content Should be Relevant…
Price is $50, it can be negotiable for bulk order…..
Waiting for Positive Response !!!!!
Regards !!!
what is the void volume role in the empower calculation. and can you give clear definition of void volume
Fill your response that both compounds 1 and 2 satisfy ICH guidliness for asymmetric factor and tailing factor. If your answer is yes or no than will provide the reason.
Magistral